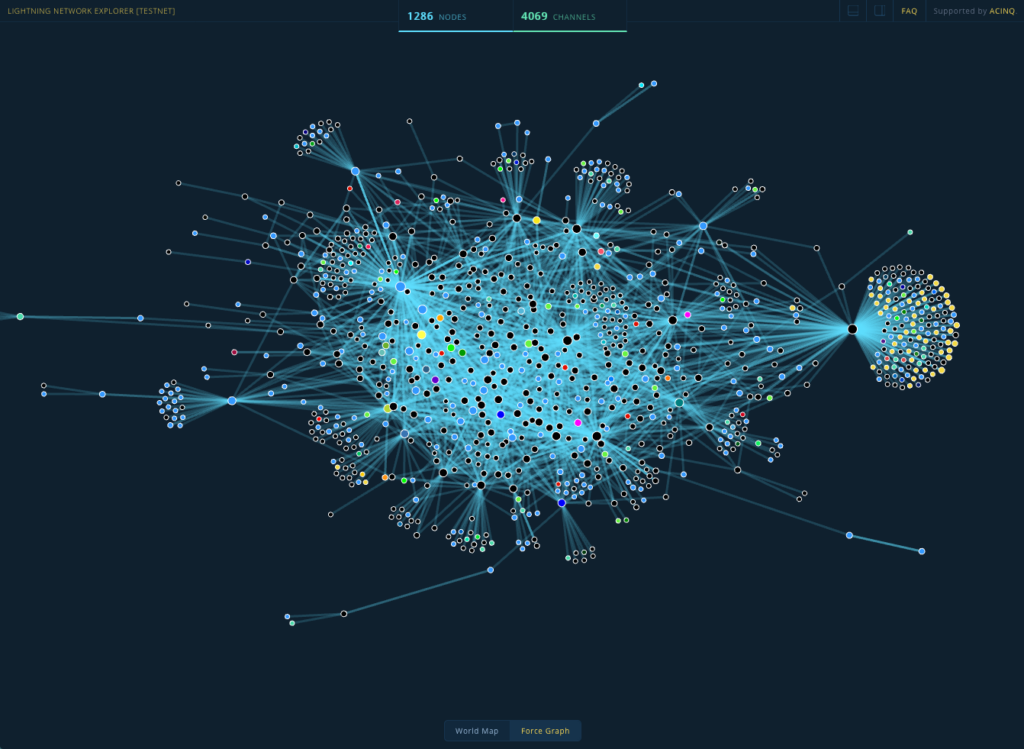
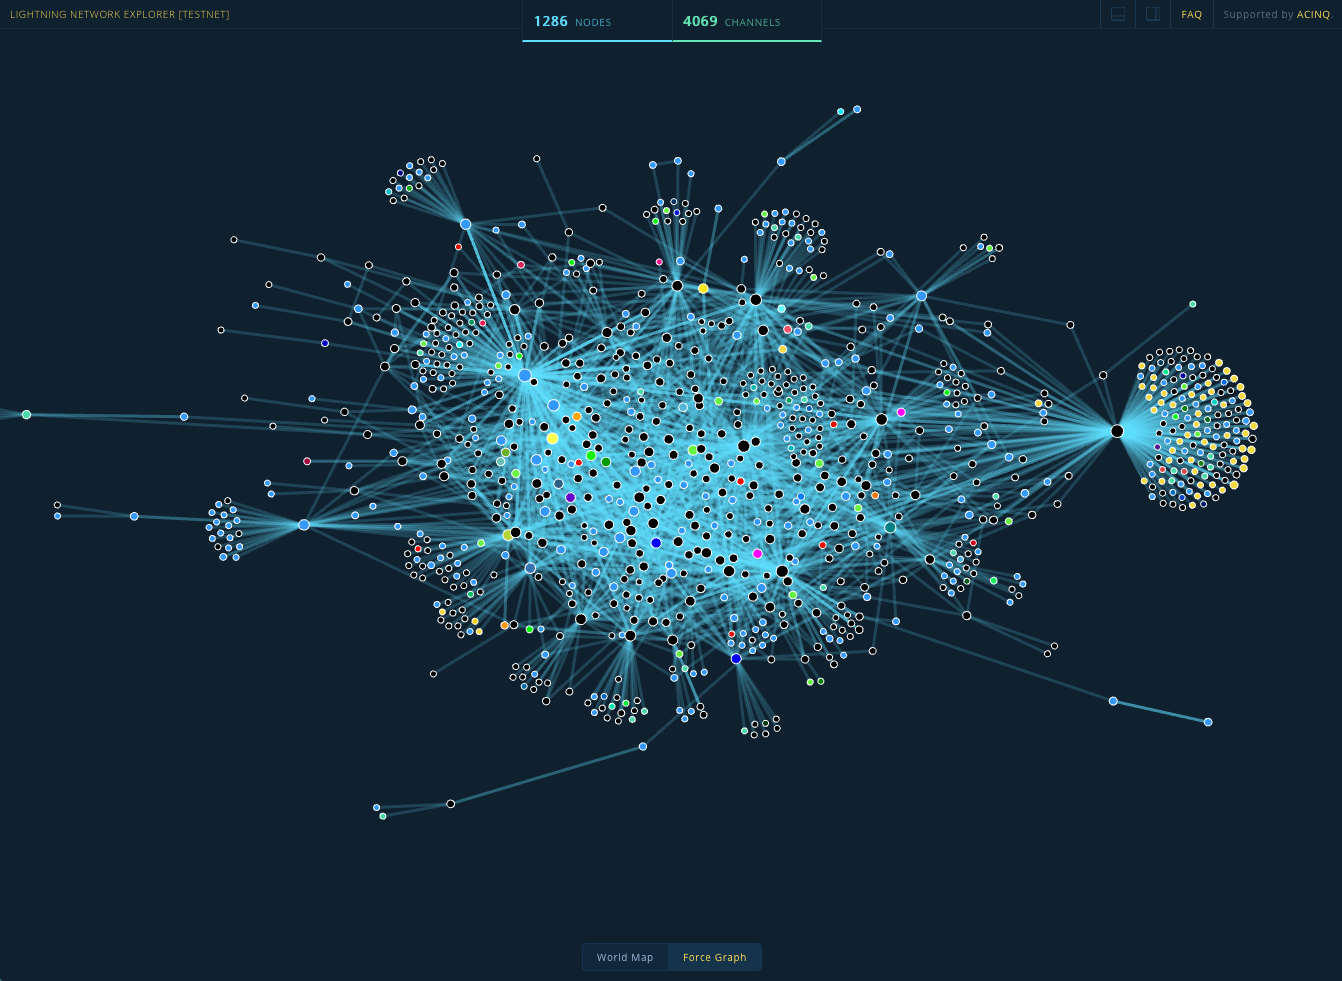
How graph the network? We have OSFP data via bird, then how use this? The CLI output is mostly stable, then I extract data from CLI output, process, output as dot format and let’s graphviz do the job.

The image is not the real image. In the graph we have the network topology, the network range, and where is the floating IP, because we provide floating IPv4 and IPv6 to the customer.
We have dev lot of tools to fix problem in real time. To have the lowest repair time.

